
 RowCraft – Table Fields for Jira
Using the app
RowCraft reports: rows across work items
The Reports page answers questions across work items: How much hardware did we order this quarter? Which supplier has the most open lines? What did each team spend on travel? It lists the rows of one table from every work item you choose, in one large table that you can filter, group with subtotals, save and export.
Open Apps → RowCraft → Reports. Every user with access to RowCraft can use reports.
Build a report
- Table: choose a table field or a panel table. Table fields with several contexts are combined; columns with the same name are aligned.
- Work items (JQL): optionally narrow the work items, for example
project = PUR AND created >= -30d. Leave it empty for all work items that have rows in this table. The JQL box has the same suggestions and validation as the search helper. - Select Search (or press Enter in the JQL box).
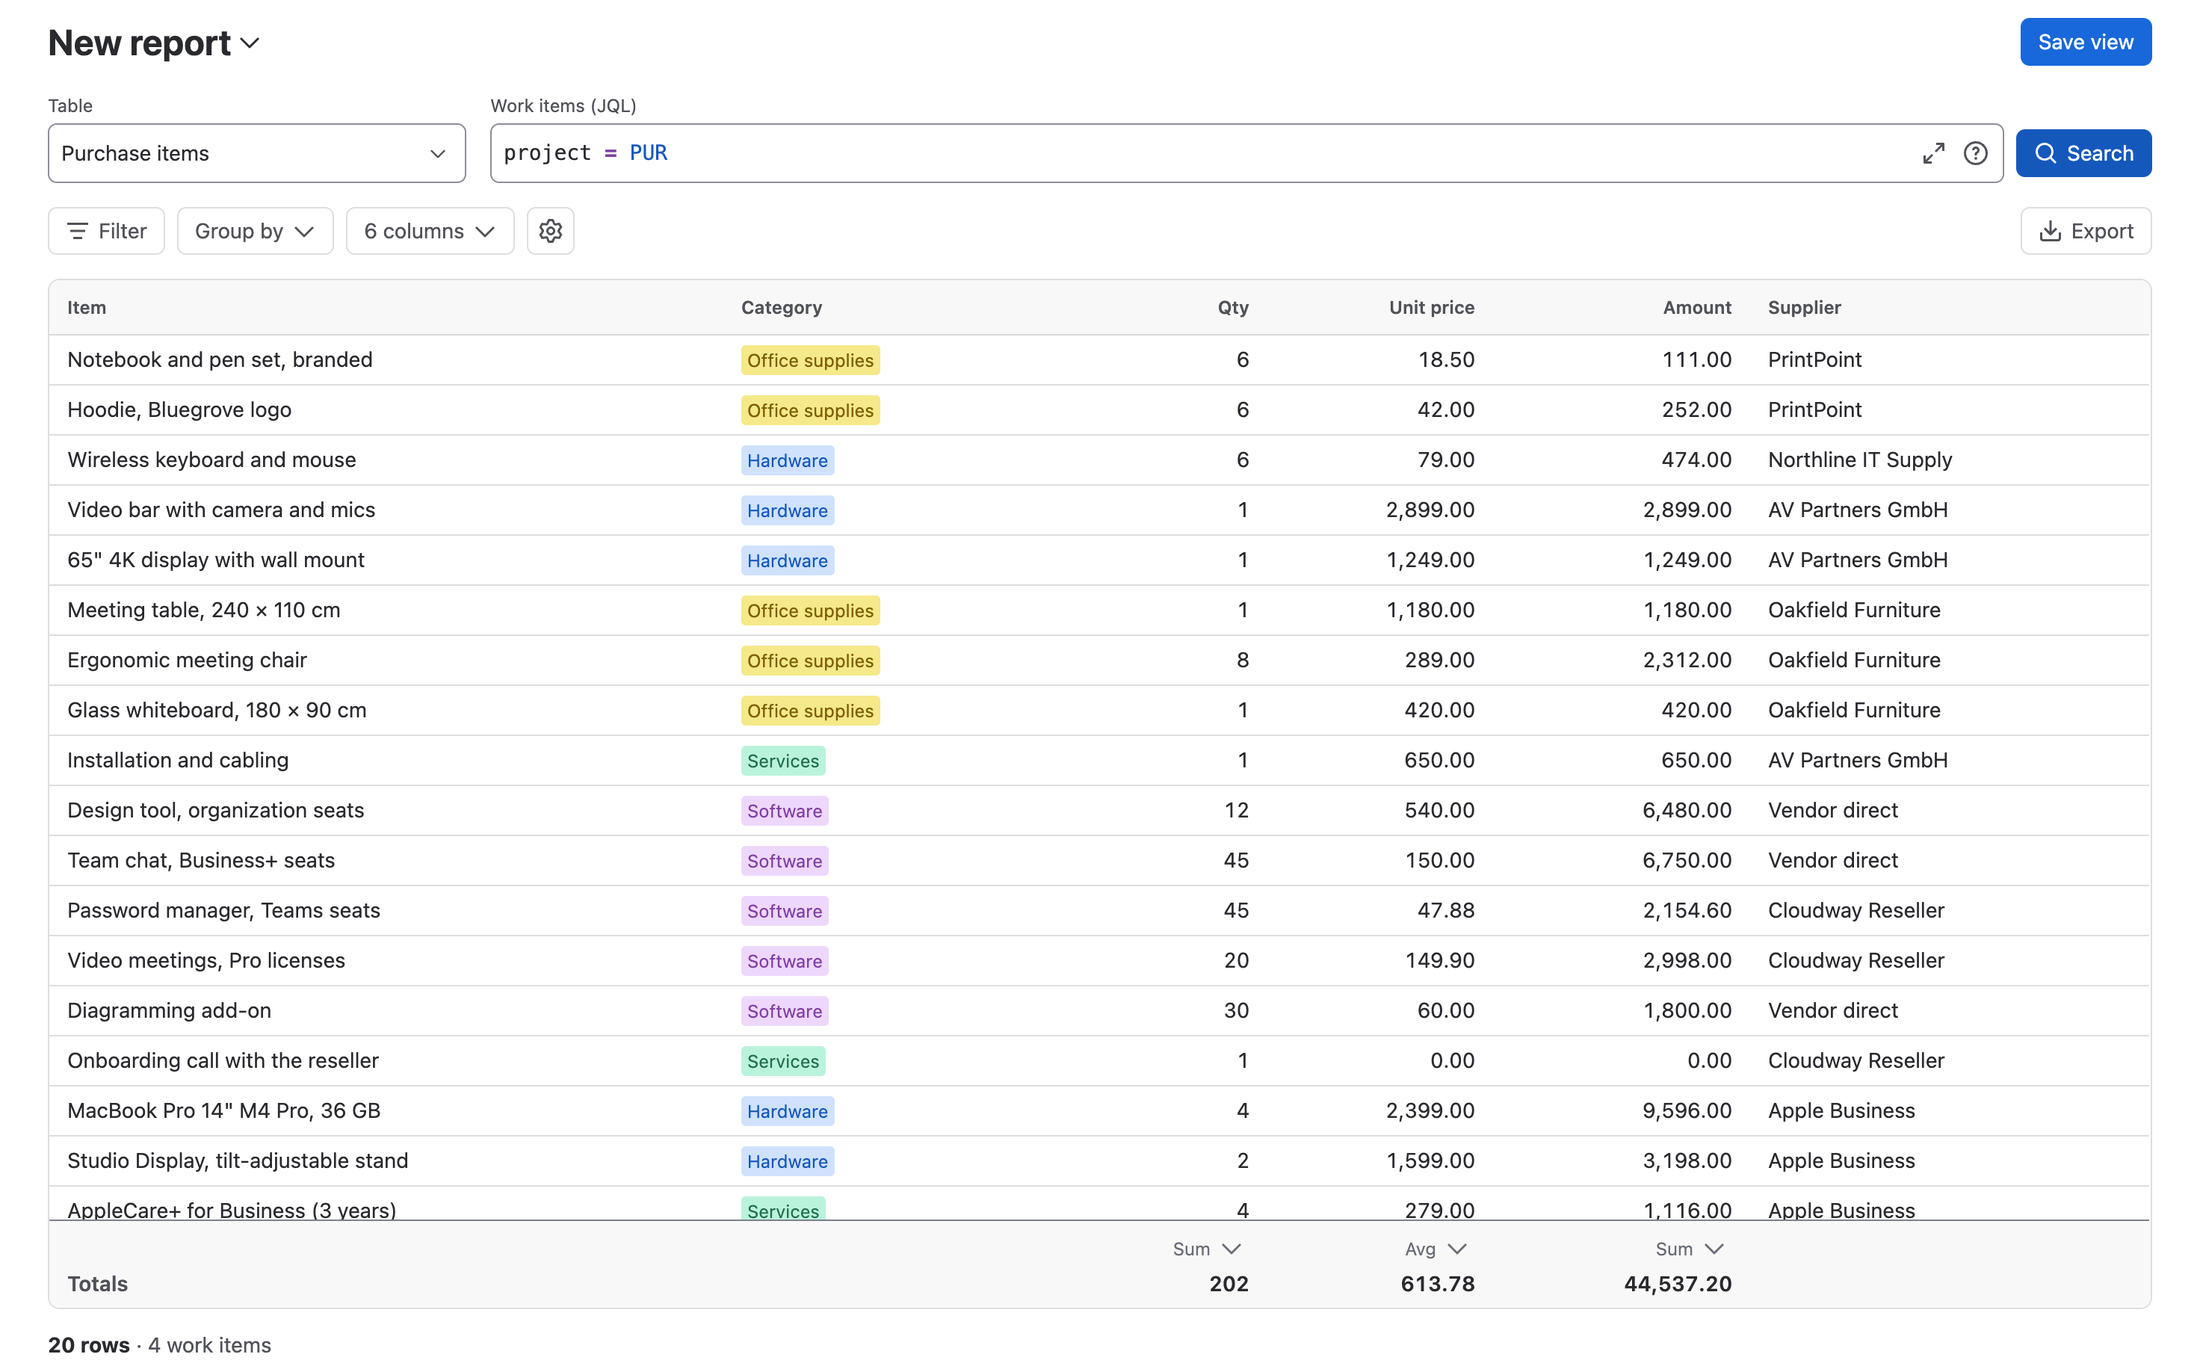
A progress bar shows how many work items were found and read; Stop ends the search early and shows the rows read so far. Under the table, the report shows the number of rows and work items.
Choose columns
The Columns button (for example 6 columns) opens the list of columns shown in the report.
- Add table columns or work item fields: Key, Summary, Status, Assignee, Reporter, Project, Work type, Priority, Created, Updated, Due date, Components, Labels and Fix versions.
- Drag a column (or use the arrow keys) to change the order, and select × to hide it. At least one column stays.
- Back to the defaults shows the table's own columns again.
Select a column header to sort the rows by it; within groups, rows are sorted inside each group.
Filter rows
Filter adds conditions on the table's columns, the same kinds as in the read-only view: text contains, options, number ranges, date ranges, checkbox state, people. The button shows how many filters are active.
Filters apply to table columns. To filter by work item fields such as status or assignee, write them in the JQL. When possible, RowCraft also turns filters into rowcraftField() or rowcraftPanel() conditions, so that fewer work items have to be read.
Totals
The Totals row at the bottom shows one value per number column. Above each value, a small label shows the statistic (for example Sum or Avg); select it to switch between Sum, Avg, Min, Max, Count or No total.
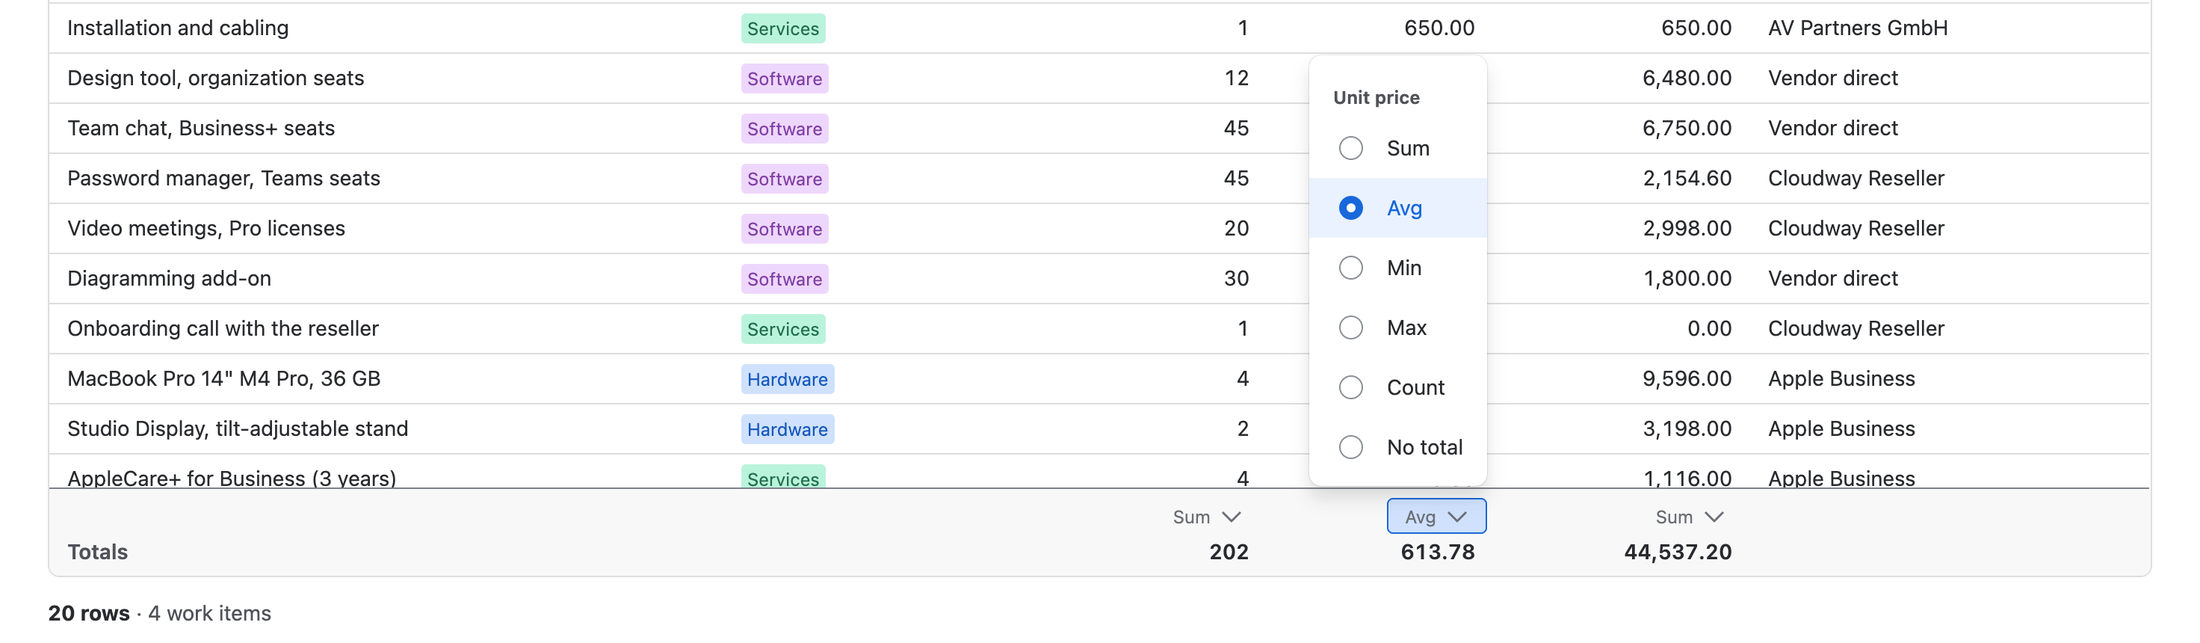
A column without a total setting starts with Avg, because adding up unit prices rarely makes sense.
Group and subtotal
Select Group by, choose a column and select Add. You can add up to three levels; drag them to change the order. Date columns can be grouped By day, By week, By month, By quarter or By year.
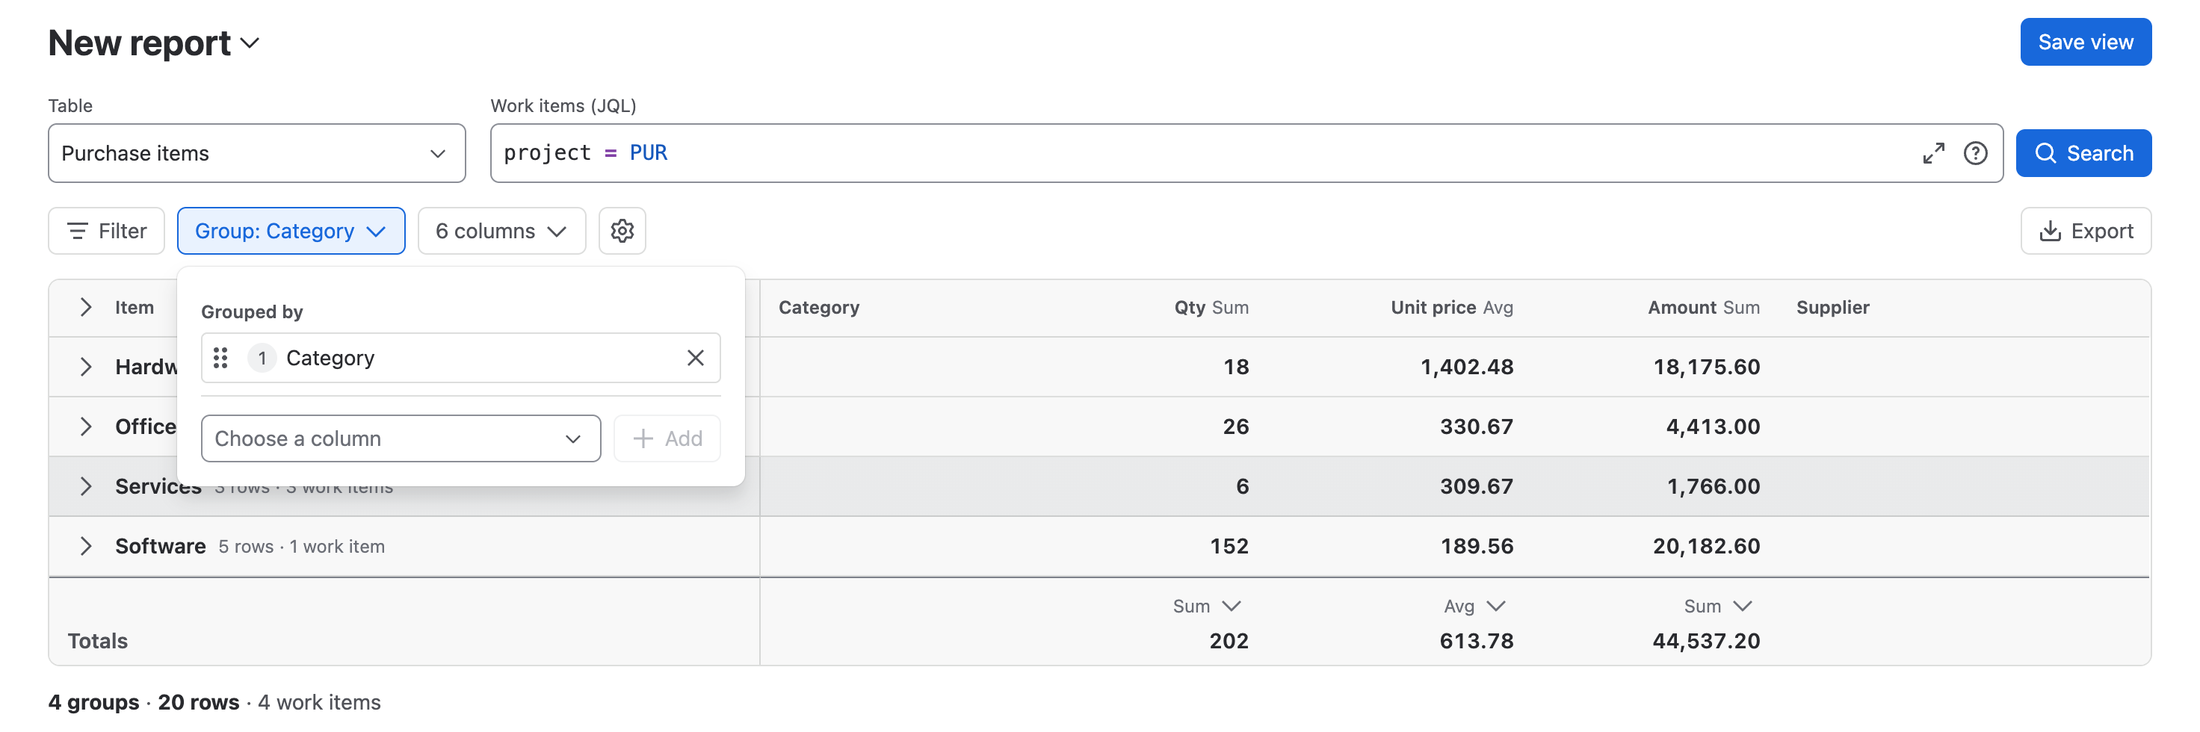
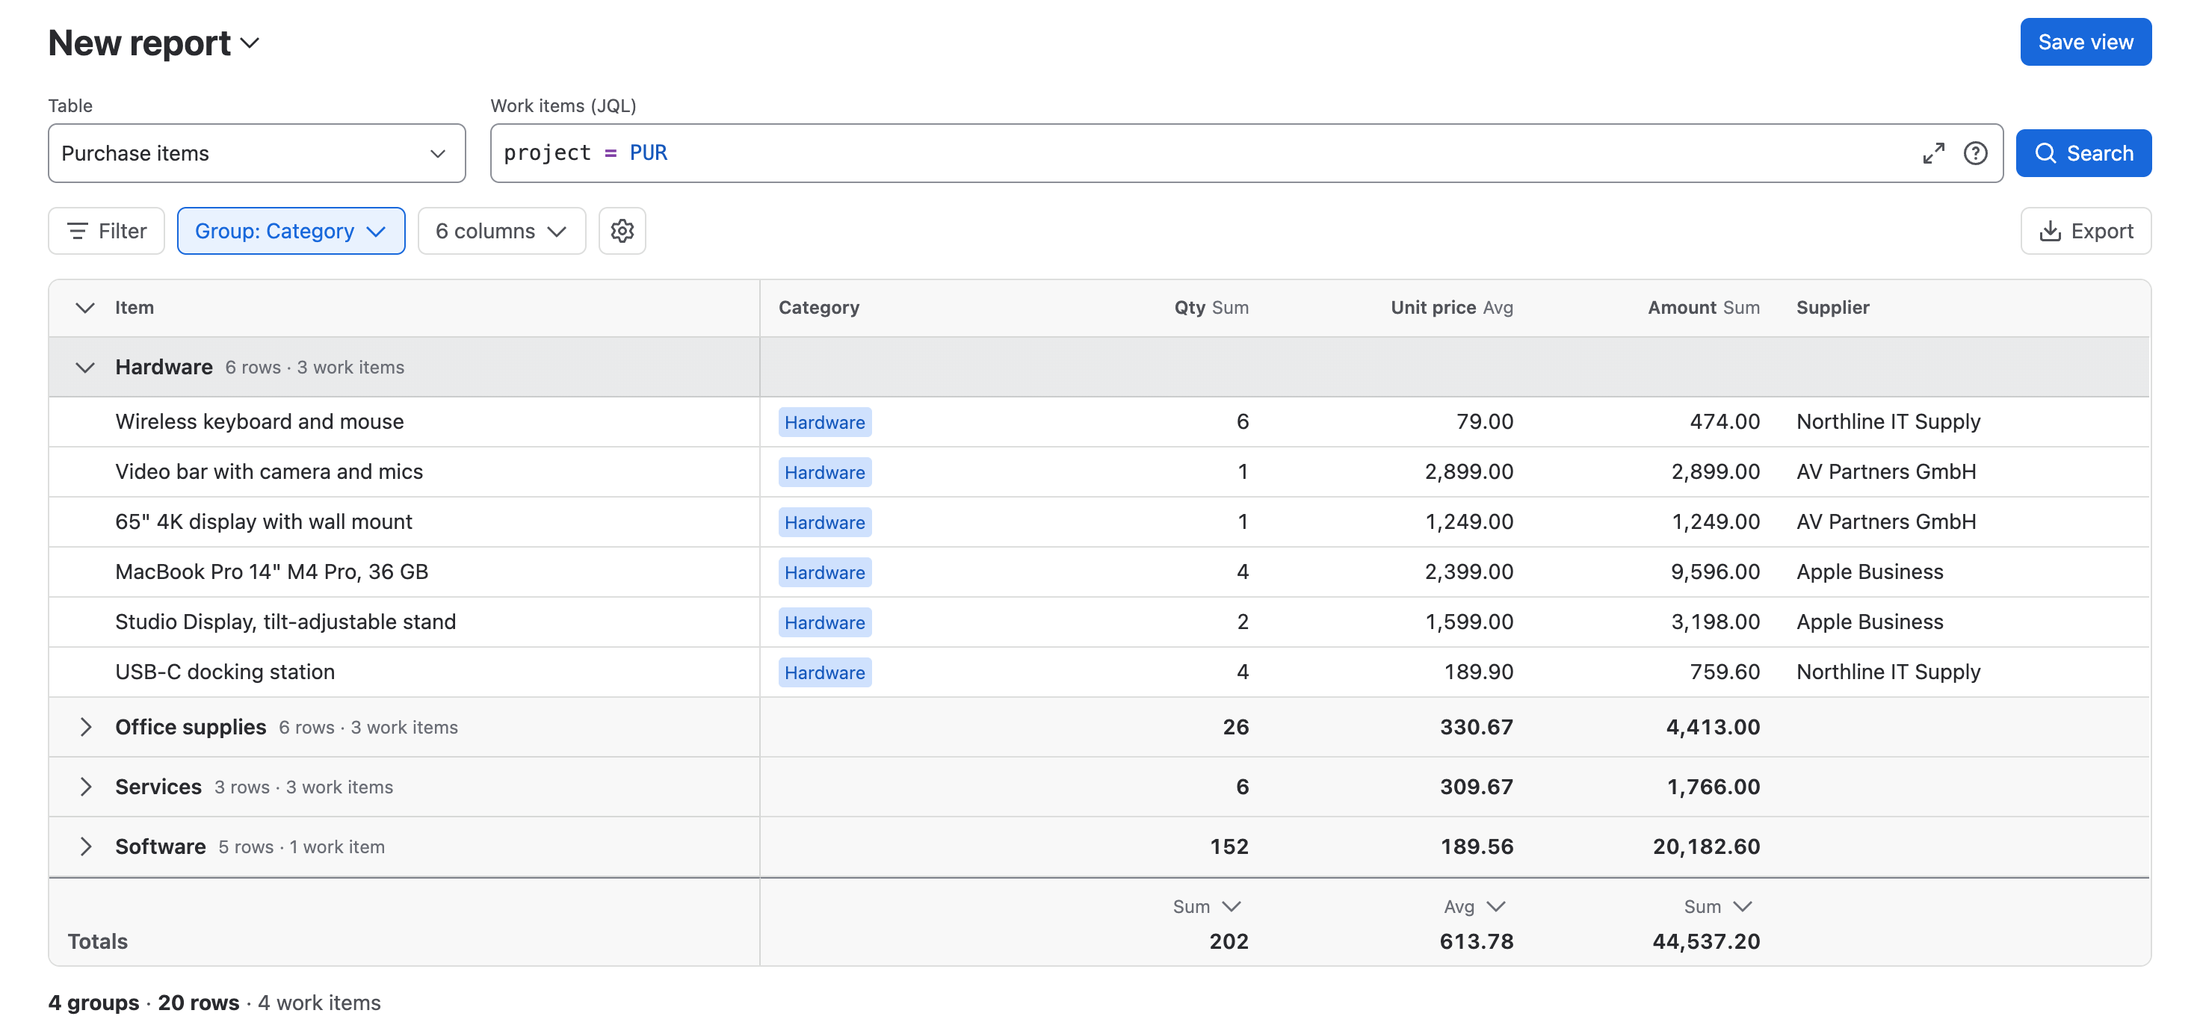
Grouped reports start with every group closed, so they read like a summary table: each group shows its name, the number of rows and work items, and a subtotal under each number column, using the same statistic as the Totals row.
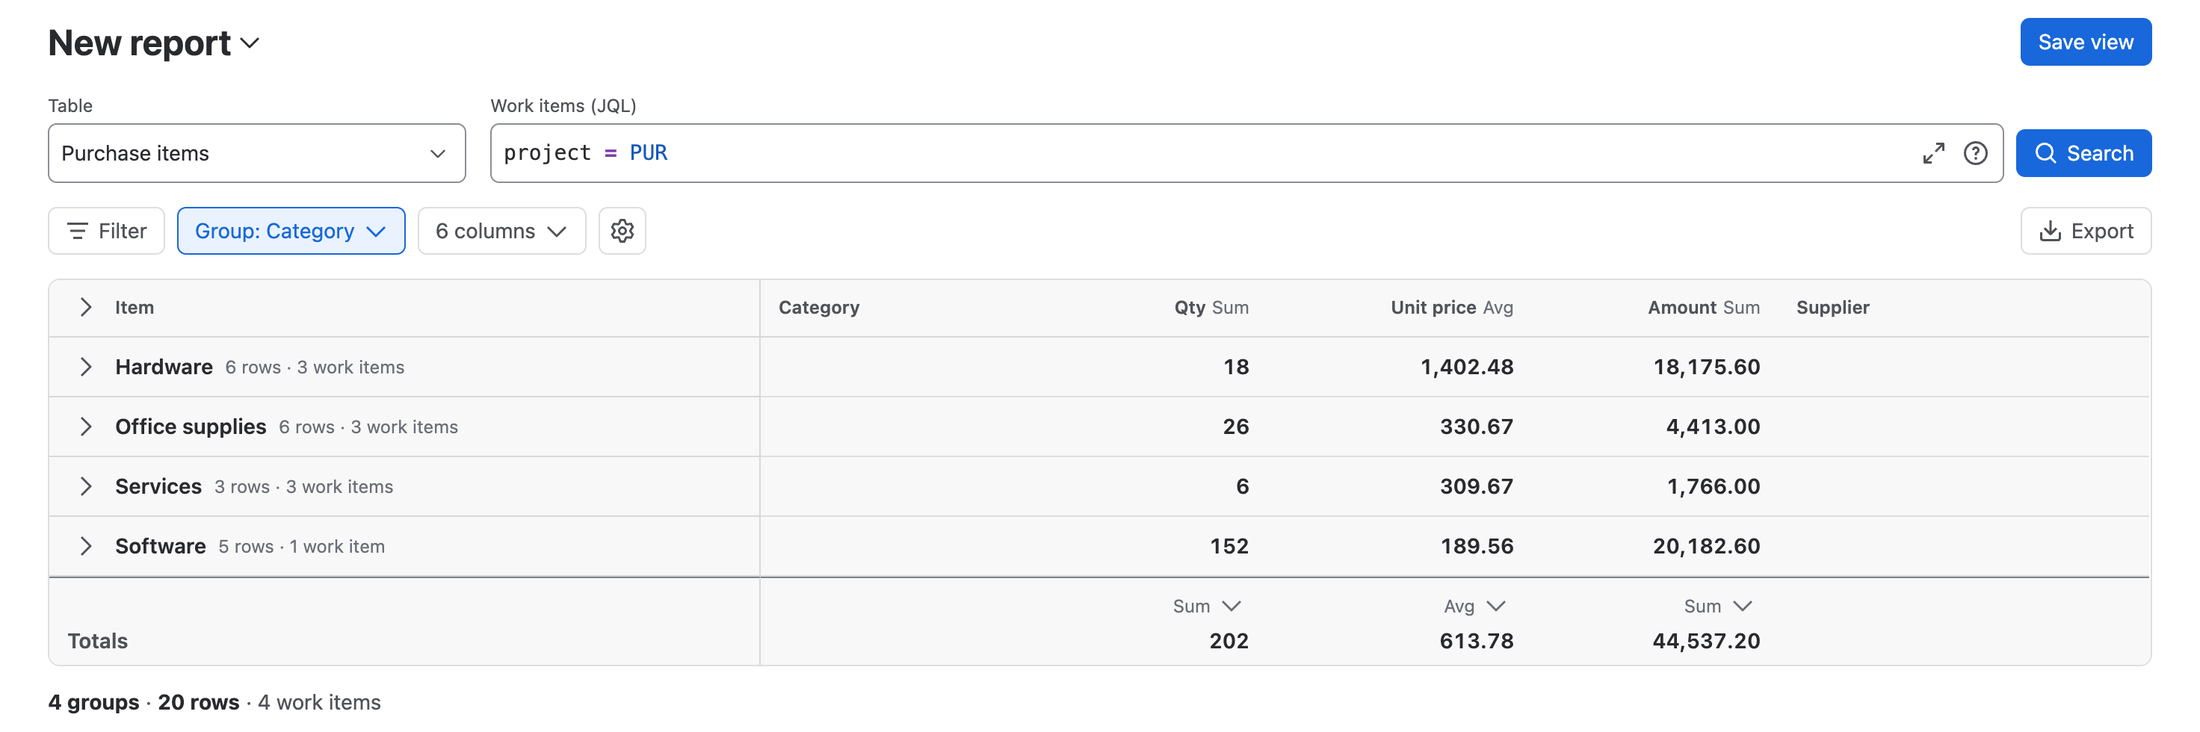
- Select a group to open it in place and see its rows. The arrow in the header opens or closes all groups.
- When you group by work item key, each group name is a link to the work item.
- Show subtotals on opened groups too (in the Group by panel) keeps subtotals visible on open groups.
Export to Excel or CSV
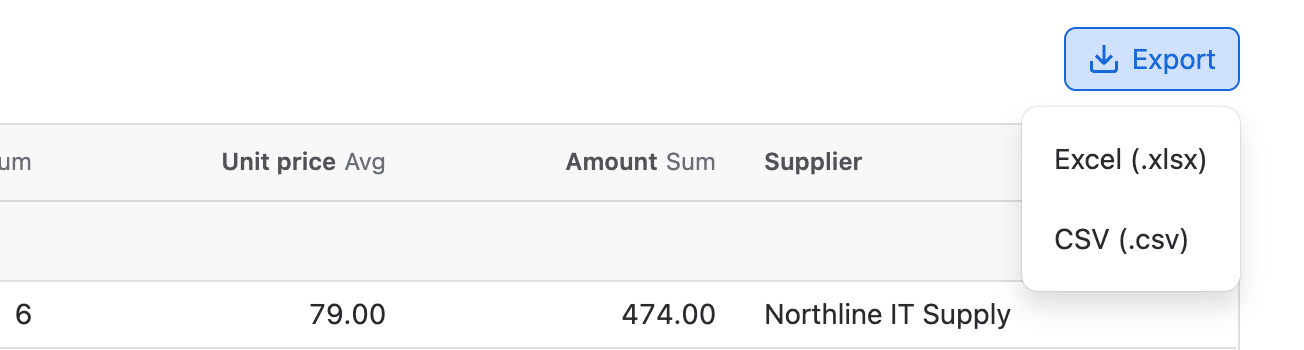
Select Export and choose Excel (.xlsx) or CSV (.csv). The file contains the report as it is shaped on screen: the shown columns in their order, the filters, the sort and the totals.
- In grouped reports, each row gets a column with the name of its group, and the groups' subtotals are included.
- Excel files keep the table colours (option colours and conditional formatting). Turn them off with Show the table's colors under the settings (gear) button.
- When columns from different contexts use different units, the total of that column has no unit, and a warning icon says so.
Save and share views
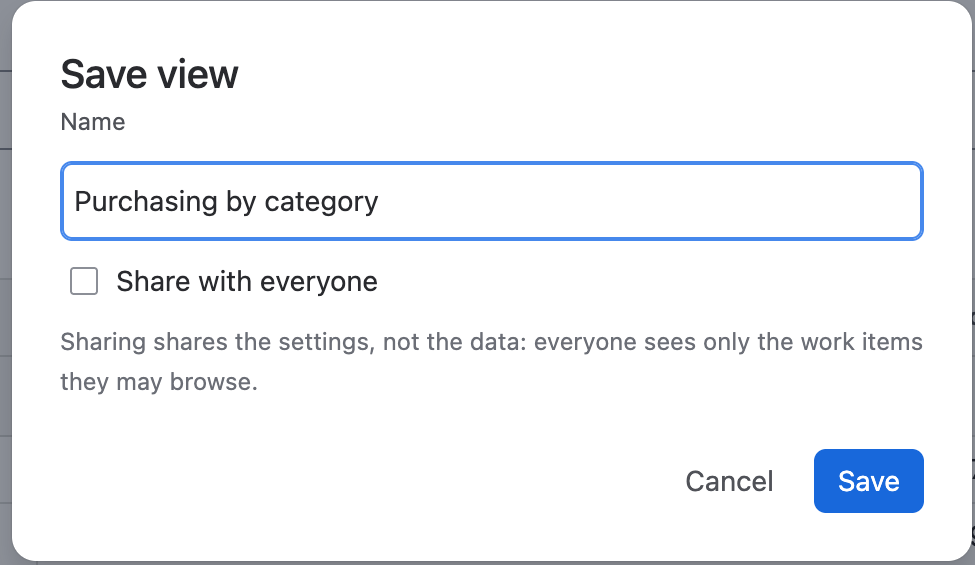
Select Save view, enter a Name, and tick Share with everyone to make the view available to all RowCraft users. A view stores the table, the JQL, filters, columns, sort, grouping, totals and colour setting.
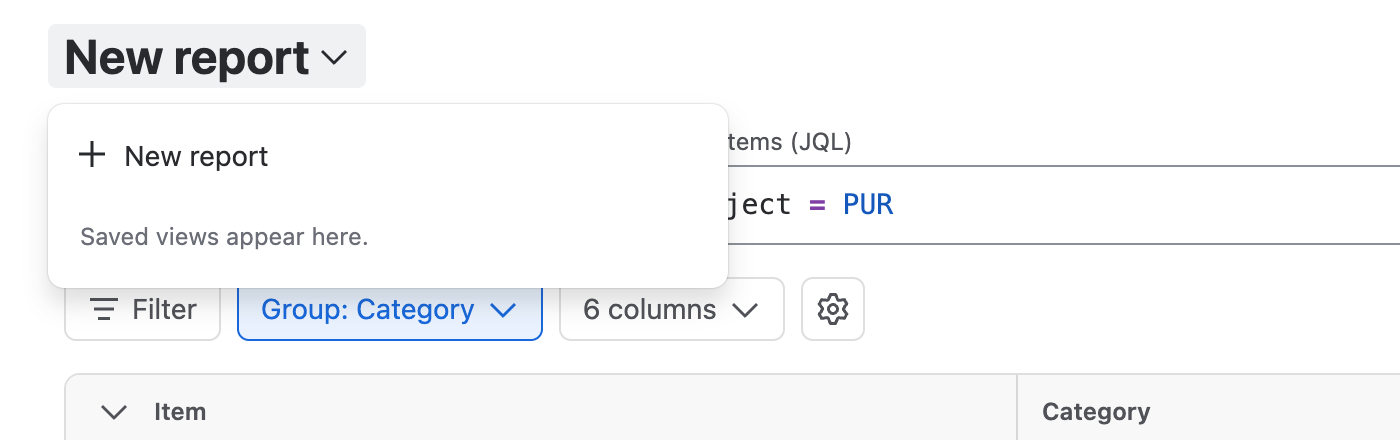
- Select the report title to open the Views panel: New report, My views and Shared with everyone. Hover over a view you own to Rename or Delete it.
- When a view has unsaved changes, Save updates it; Save as new view in the ••• menu keeps the original.
- Only the person who saved a view, or a Jira administrator, can change or delete it. Others can save a copy.
- A site can have up to 500 saved views, and each person up to 100.
Limits
- A report reads up to 20,000 work items and 200,000 rows. If the search finds more work items, RowCraft asks first: Read the first 20,000, or Change the search.
- When a report stops at a limit, it says how much was read, and the totals, subtotals and export only count what was read (marked with ⚠ next to the totals).
- Columns that a saved view uses but that the table no longer has are reported in a message, and their filters, sorting and grouping are not applied until you choose them again.