

 StatusPath Reports
Guides
Weekly Jira Workflow Report Example for Management
A useful weekly Jira workflow report records the decision question, Jira population, history window, calendar, sample size, trend, rework signal, outliers, and next action on one page. It does not replace the underlying report. Management gets a concise conclusion, while reviewers retain the Saved Report, chart, table, and Jira History needed to reproduce it.
Copy this one-page weekly report template
| Section | What to record | Example from this guide |
|---|---|---|
| Reporting question | One decision the report supports | Does Review need a capacity or policy change? |
| Jira population | Source and inclusion rule | 20 completed SR Stories, four per created week |
| Calculation definition | History boundary, Calendar, Format | Full history; UTC weekdays 09:00–17:00; Decimal Hours |
| Headline signal | Current comparable value and baseline | Review rose from 14h to 16h week over week |
| Sample size | Contributors behind each period | Four Stories in every weekly cohort |
| Rework signal | Exact directional movement | Review → In Progress occurred twice in the latest cohort |
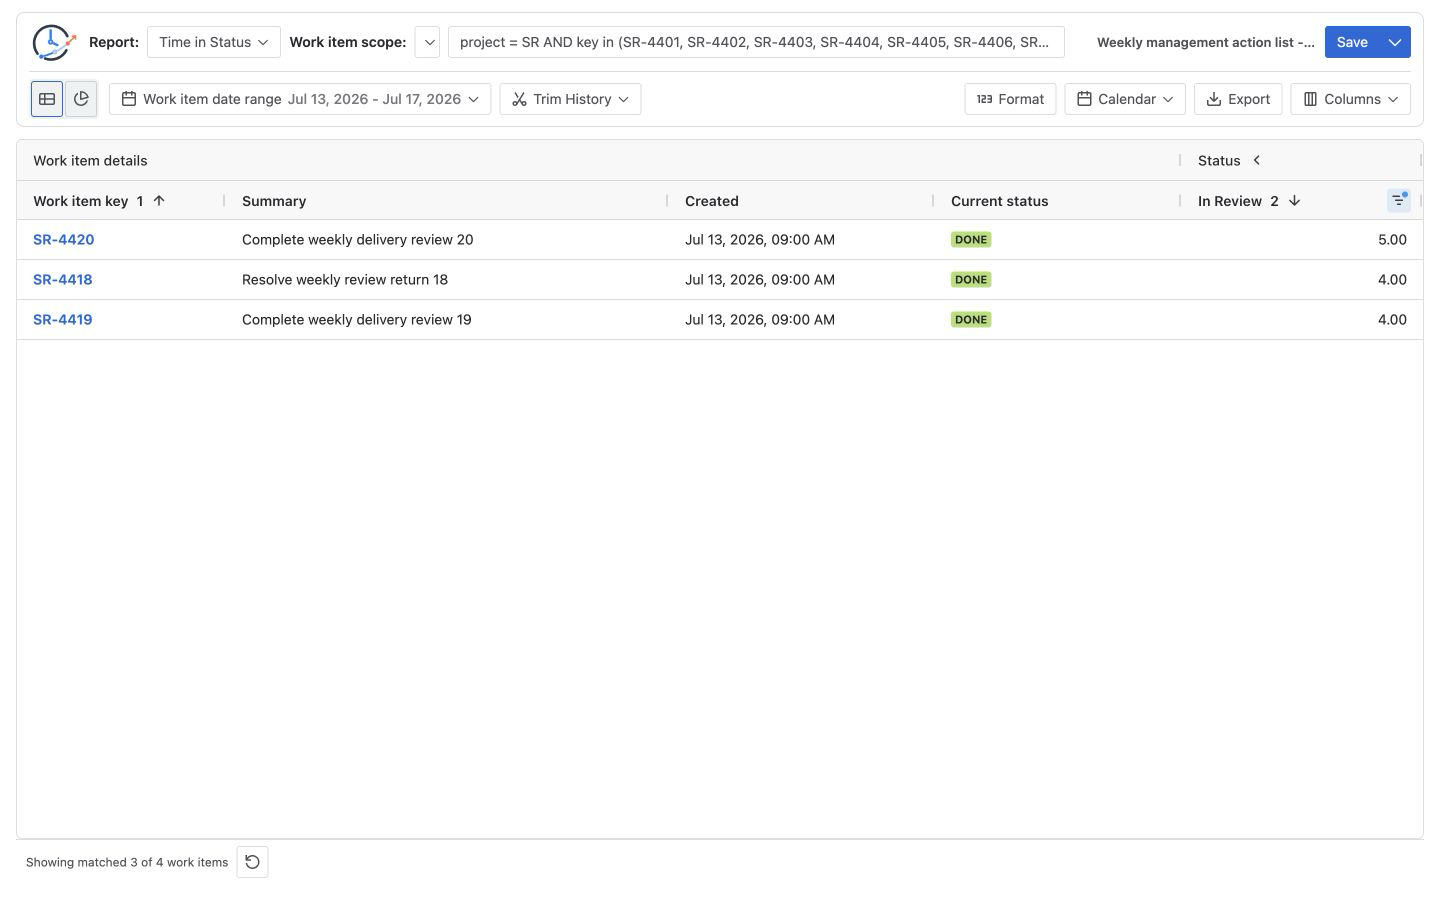
| Action list | Named rows that need review | SR-4418, SR-4419, and SR-4420 have Review time of at least 4h |
| Decision log | Owner, action, due date, recheck rule | Review four unique histories; test a reviewer rota; refresh the rolling population and rerun next week |
| Evidence | Links to reproducible artifacts | Saved Report, table, chart export, Jira work-item histories |
This is a manually completed reporting template. StatusPath Reports supplies the calculated tables, charts, Saved Report configuration, and exports; it does not generate the management narrative or decide the action.
Worked Jira scenario: a five-week Review increase
A controlled Jira scope contains 20 completed Stories, SR-4401 through SR-4420. Four Stories were created in each completed Monday-to-Friday reporting period, using UTC dates. Every run uses the same Jira scope, full history, Weekdays 09:00–17:00 (UTC) Calendar, Decimal Hours, and Monday-start weekly buckets.
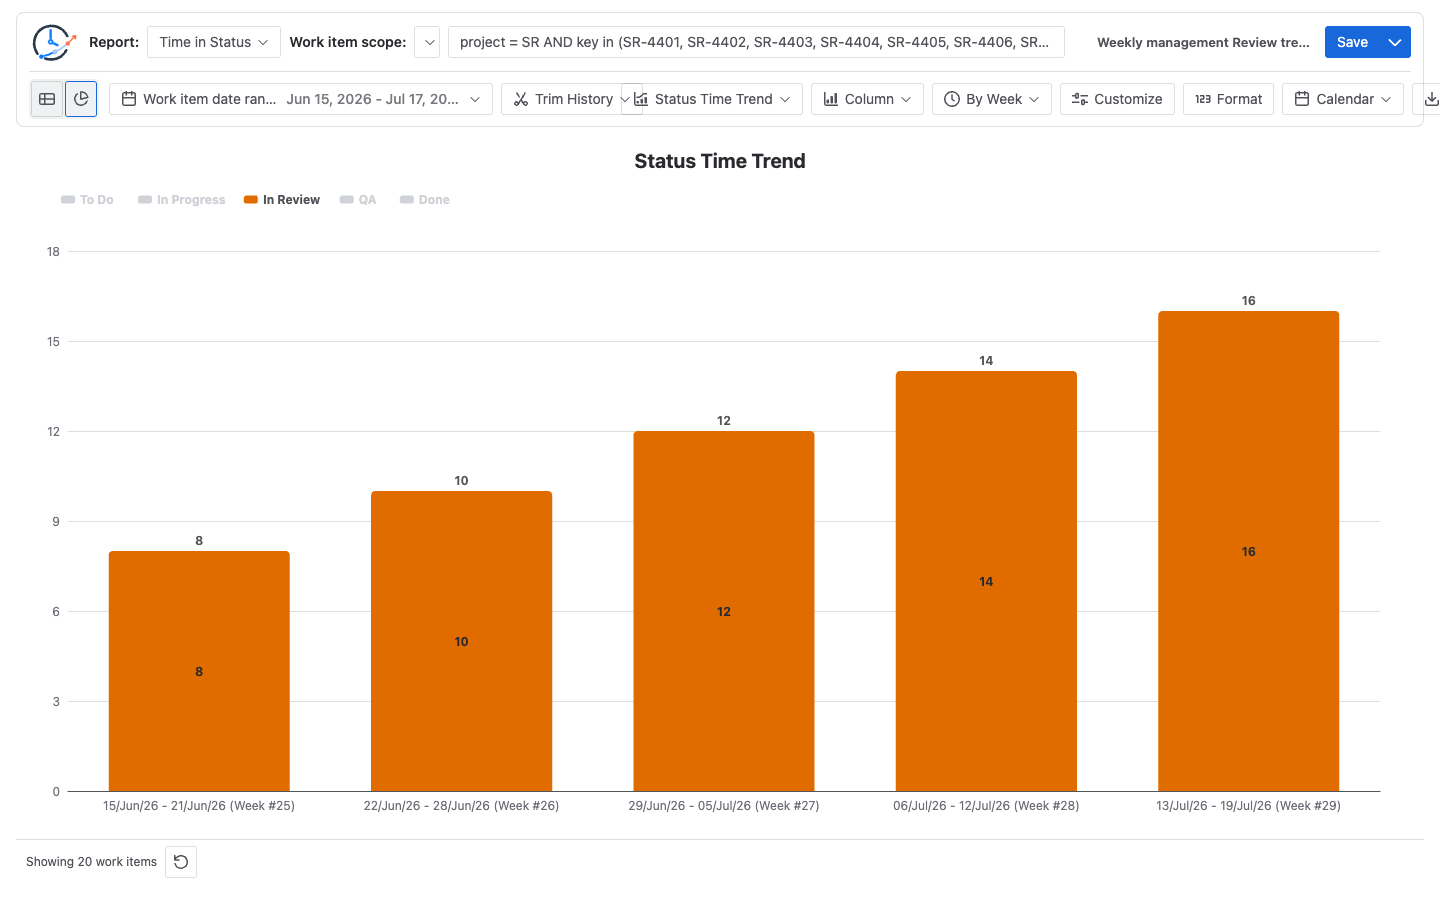
This controlled example keeps every measured status segment inside the Story's creation-week bucket, so the five chart buckets reconcile with the five cohorts below. Status Time Trend does not generally define cohorts by Created date.
| Created-week cohort | Stories | In Progress | In Review | QA | Review → In Progress |
|---|---|---|---|---|---|
| 2026-06-15 to 2026-06-19 | 4 | 40h | 8h | 20h | 0 |
| 2026-06-22 to 2026-06-26 | 4 | 40h | 10h | 20h | 0 |
| 2026-06-29 to 2026-07-03 | 4 | 40h | 12h | 20h | 1 |
| 2026-07-06 to 2026-07-10 | 4 | 40h | 14h | 20h | 1 |
| 2026-07-13 to 2026-07-17 | 4 | 40h | 16h | 20h | 2 |
The latest cohort's Review values are 3h, 4h, 4h, and 5h. Apply In Review ≥ 4h, then sort Review in descending order to produce a three-item action list.
Manually verify the weekly conclusion
The five weekly Review bucket totals reconcile with the same 20 detail rows because no measured segment crosses a weekly boundary:
Five-week Review total = 8h + 10h + 12h + 14h + 16h = 60h
Overall Review mean    = 60h ÷ 20 Stories = 3h per Story

Latest week change     = 16h - 14h = 2h
Relative change        = 2h ÷ 14h = 14.29%
Latest action-list sum = 4h + 4h + 5h = 13h
Action-list share      = 13h ÷ 16h = 81.25%
The calculation supports a narrow statement: the latest four-Story cohort accumulated two more business hours in Review than the prior four-Story cohort, and three rows contributed 13 of the 16 hours. It does not prove that reviewers are understaffed, that the team is less productive, or that a universal threshold was breached.
Atlassian's Control Chart documentation recommends examining variation and outliers and applies to company-managed spaces. Jira's Cumulative Flow Diagram can show a widening board-column band that generally indicates a bottleneck, but its meaning depends on board-column mapping. Those native views are useful corroboration; neither uses this template's one-status cohort definition by default.
Build the evidence pack in StatusPath Reports
1. Freeze the reporting question
Use a decision such as “Should we test a Review capacity or policy change next week?” Avoid a generic request to “show workflow performance.” The workflow bottleneck guide explains how to establish a systemic signal before packaging it for management.
2. Hold the Jira population constant
For this example, the source is:
project = SR
AND key in (SR-4401, SR-4402, SR-4403, SR-4404,
            SR-4405, SR-4406, SR-4407, SR-4408,
            SR-4409, SR-4410, SR-4411, SR-4412,
            SR-4413, SR-4414, SR-4415, SR-4416,
            SR-4417, SR-4418, SR-4419, SR-4420)
ORDER BY created ASC
Atlassian documents advanced JQL search as a way to express precise work-item criteria and order results. JQL defines the population here; StatusPath calculates the history-derived durations and directional counts.
3. Save the metric definition
Run Time in Status, retain only the three workflow stages needed for the review, and record:
- Full history with no Trim History boundary.
- Weekdays 09:00–17:00 in UTC.
- Decimal Hours.
- Monday as the weekly bucket start.
- Four completed Stories whose measured segments remain inside each creation-week bucket in this controlled example.
Use a named Saved Report so the setup can be restored. A Saved Report stores reusable configuration, not frozen Jira rows; reruns can change when Jira data, calendars, permissions, or histories change. The explicit key list above makes this example reproducible. For recurring operations, replace it with a rolling saved filter or update the population while preserving the inclusion rule and calculation definition.
4. Show the trend, then return to the rows
In Chart view, choose Status Time Trend, Week, and In Review. Under this controlled condition, the chart shows five weekly bucket totals that match the five created-week cohorts. For the action list, choose Created in Work item date range, set the range to the latest week, and rerun; then return to Table, apply In Review ≥ 4h, and sort descending. Do not treat the Created detail column as a table-header filter.
5. Add a defined rework signal
Set Work item date range to Created for 2026-07-13 through 2026-07-17, then run Transition Count and select the explicit In Review → In Progress column. This reproduces the latest cohort's two return movements, on SR-4417 and SR-4418. Do not label every return “defective”: the direction identifies work to inspect, not its cause.
Atlassian explains in its workflow transition documentation that Jira transitions are one-way, so a return path requires its own transition. Its JQL operator reference documents status CHANGED FROM ... TO ... for finding matching work items; it does not document a per-row transition-count report. Use the transition-direction template to define the exact pairs included in the weekly metric.
6. Link the headline to evidence and a decision
A defensible summary for this scenario is:
Four Stories completed in each weekly cohort. Review time rose from 14h to 16h in the latest cohort. Three Stories contributed 13h, and two Review → In Progress returns need history review. The sets overlap on
SR-4418, leaving four unique Stories to inspect. Maya will review those histories before the team tests a reviewer rota; next week the rolling population will be refreshed and the same calculation definition rerun.
Validate representative work items in Jira. Atlassian says the work item's Activity → History includes field edits and workflow movements. Record links to the relevant work-item histories rather than copying an unexplained chart into a slide.
7. Export the right artifact
Use PNG, PDF, or SVG from Chart view for the visual. Use CSV or XLSX from Table view for the action list. The StatusPath export documentation explains that chart and table export are separate and that an export is point-in-time output, not a live report.
Common mistakes
Reporting a value without its denominator
“Review reached 16 hours” is incomplete unless the reader also knows that four Stories contributed and that the cohorts are comparable.
Mixing row selection with history clipping
Selecting Stories created in one week and trimming all histories to that week answer different questions. Record both boundaries explicitly.
Comparing different calendars or bucket rules
Elapsed time, business time, UTC, local time, Monday-start weeks, and Sunday-start weeks can produce different values or period labels. Preserve the Calendar and bucket definition.
Treating a chart as causal evidence
The trend identifies where to investigate. Work-item history and operational context are still needed before attributing the increase to staffing, policy, quality, or dependency delay.
Calling every return rework
A return can represent a scope change, a valid workflow route, missing information, or a correction. Define exact from/to pairs and review samples.
Presenting the template as automatic narrative generation
StatusPath provides evidence and export. A person selects the conclusion, owner, action, due date, and recheck rule.
Frequently asked questions
What should a weekly Jira management report contain?
At minimum: the decision question, Jira population, selection and history windows, metric, Calendar/timezone, sample size, current and comparison values, action rows, limitations, owner, next action, and evidence links.
Should the weekly report use total or average Review time?
Use the measure that matches the decision and keep the other available for reconciliation. A total shows accumulated time; an average normalizes by contributors. See Average vs Total Time in Status.
Can Jira's native reports replace the row-level evidence?
Native reports answer useful board and space questions. Atlassian's reports overview describes Control Chart and Cumulative Flow behavior. Keep StatusPath detail rows when the summary depends on one-status durations or explicit transition counts.
Is a Saved Report a weekly snapshot?
No. It stores reusable setup and queries current Jira data when rerun. Export the table or chart when a point-in-time artifact is required.
Is a 14.29% weekly increase automatically significant?
No. It is the arithmetic change in this controlled five-week example. Significance and action depend on sample size, variability, comparable scope, operational context, and repeated evidence.
Related Guides
- Jira Workflow Review Checklist
- Jira Transition Direction Report Template
- How to Find Jira Workflow Bottlenecks
- Jira Workflow Reporting Guide
Keep the summary short and the evidence reproducible
A weekly management report should reduce reading time without removing the controls needed to challenge the conclusion. Keep one decision, one stable scope, one calculation definition, one trend, one action list, one defined rework signal, and one owner together.
Try StatusPath Reports on the Atlassian Marketplace to build the weekly table and chart from a reusable Jira report configuration.